


 . You may be eligible. See how it works
 . You may be eligible. See how it works
Your fertility is more than a test result.
You can have a normal HSG. Normal AMH and FSH. A normal ultrasound. A normal semen analysis.
And still know something is not adding up.
Conceivable helps you look at the information that often gets left between the lines: your cycle, energy, bleeding, temperatures, sleep, metabolism, symptoms, recovery, nutrition and environment. Then it shows you the pattern they create together.
About 15 minutes of questions. Delivered within 24 hours.
Your Score shows where to look. Your Report shows you why, and what to do first.
As seen in TechCrunch HuffPost goop mindbodygreen Fox News Parade“Everything looks normal” does not always mean there is nothing more to learn.
Conventional fertility testing is essential. It is designed to find important problems such as blocked fallopian tubes, ovulatory disorders, diminished ovarian reserve, uterine abnormalities and sperm factors.
But fertility is not binary.
A person can fall inside normal clinical ranges and still have details worth a closer look. In one preconception cohort of pregnancy planners, cycle length and age at menarche may act as markers of fertility potential (Wesselink et al., 2016).
One signal may mean very little. The pattern can mean more.
Your body does not work in straight lines.
These are common experiences people describe, not research findings. Poor sleep can leave you more tired. Fatigue can mean more caffeine. More caffeine can make sleep worse.
Hard training without enough fuel can leave less energy available for recovery and for the rest of the body (Mountjoy et al., 2023).
When fatigue, poor recovery, short or unusual bleeding, high training load, sleep disruption and metabolic symptoms cluster together, they may tell us more than any one symptom could alone. That does not mean a tired person is infertile.
These are reinforcing loops. Conceivable is designed to look across them.
- Fatigue and poor recovery
- Short or unusual bleeding
- High training load
- Sleep disruption
- Metabolic symptoms
Any one of these may mean very little. Together, they may say more.
One number gives you a place to start. The pattern behind it is where the useful information lives.
Your Conceivable Score organizes your information into five domains.
Energy
Are there signs that nutrition, metabolic health, activity, sleep or recovery may be placing extra demands on the system?
Blood
What can menstrual bleeding, relevant nutrient status and other blood-related signals tell us, and what remains a traditional or exploratory interpretation?
Hormones
What do cycle regularity, ovulatory signs, reproductive symptoms, PCOS and endocrine context and relevant labs suggest?
Temperatures
What do basal or wearable temperature patterns tell us about cycle timing and longitudinal reproductive physiology?
Stress
How are stress, sleep, recovery and autonomic load interacting with the rest of the picture?
These are not five diagnoses and they are not the five causes of infertility. They are five ways of organizing a complex pattern. How the Conceivable Score works.
Your Score tells you where to look. Your Report tells you why.
Two people can have the same Score for completely different reasons. One woman’s lower Energy score might come from poor sleep, afternoon crashes and hard training. Another’s might come from very short bleeding, low appetite and signs of low nutrient reserves.
The number alone can’t tell either of them what to do next.
The Report can.
These two women are illustrations, not real people.
Your personalized fertility interpretation
Know what to work on first.
Not just your score. Your Report shows what may be driving it, how your signals connect, what looks reassuring, what deserves attention, and what to work on first.
It is personalized to your answers, a long and detailed report, delivered after a short human quality check. One-time $89.
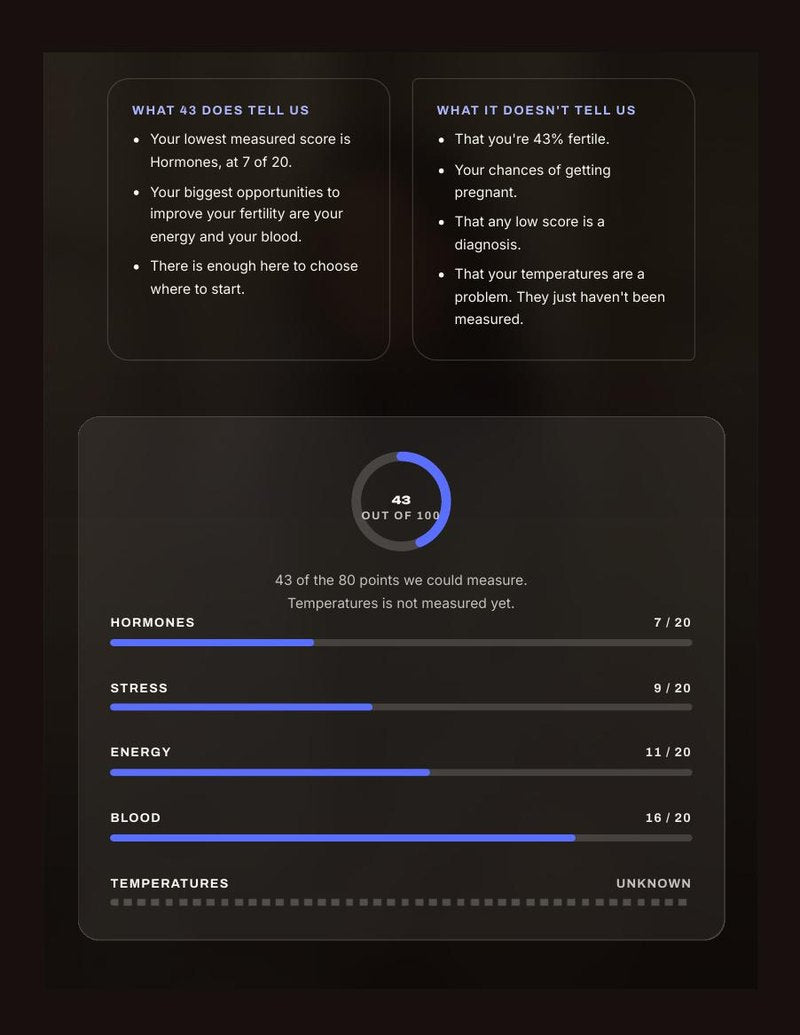
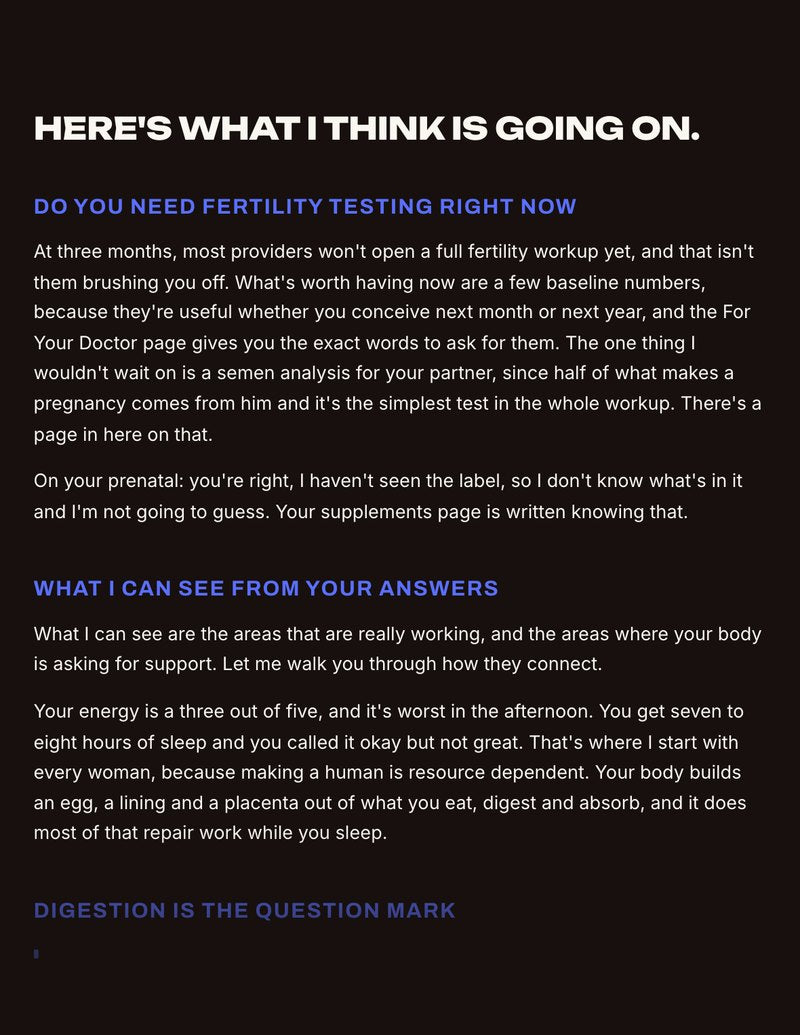
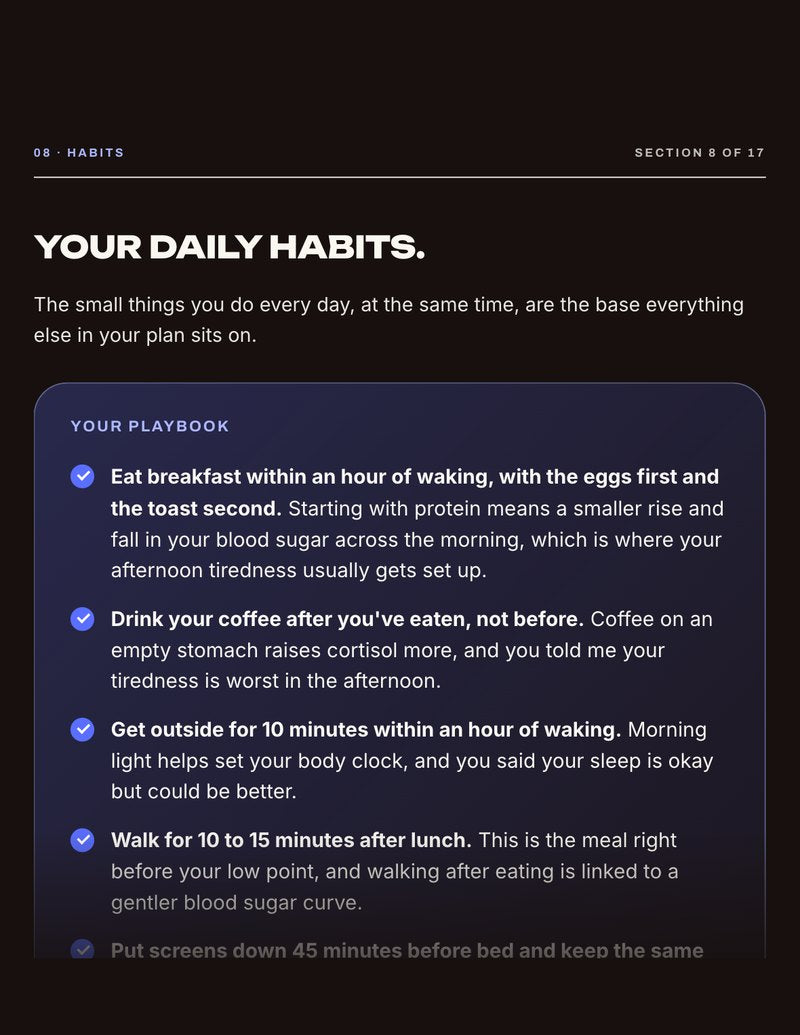
Sample pages from a fictional report.
Your Score and Your Full Report
- Your overall Conceivable Score
- Your five domain scores
- A starting point
- What’s driving each score
- How your symptoms may connect
- Your strongest and weakest patterns
- What the research says about each signal
- What to work on first
- Questions to take to your doctor
In your Report, you’ll learn:
- Which 3 to 5 signals are doing the most work in your pattern
- Which signals reinforce each other
- What looks reassuring
- What deserves more attention
- What the research says
- What to work on first
- What to ask your doctor about
If your Report feels generic or doesn’t clearly explain your pattern, tell us and we’ll make it right.
A low Score does not mean “infertile.” A high Score does not rule out a medical problem.
The goal is not perfection. The goal is clarity.
The Conceivable Score and Report are prioritization and tracking tools, not a diagnosis or a pregnancy probability. Current version: Conceivable Score v2026.10.
Built from different kinds of evidence, and we tell you which is which.
Clinical reference ranges ask whether something is clearly abnormal and needs medical evaluation. Research can ask another question: among people without overt disease, are some patterns associated with better or worse reproductive outcomes? Conceivable uses that research as context, never as a diagnosis. Exercise can be healthy overall, while very high training load combined with inadequate fueling is a recognized concern in sports medicine (Mountjoy et al., 2023).
Established reproductive science
Clinical guidance and high-quality evidence.
Supported human research
Prospective cohorts and other studies that identify meaningful associations.
Emerging science
Promising findings that still need replication or better trials.
Clinical pattern recognition
More than two decades of experience seeing reproductive-health patterns in practice.
Traditional medicine
Traditional Chinese medicine concepts, clearly labeled as a traditional lens rather than biomedical fact.
Conceivable’s own data
Historical internal findings, clearly labeled and never presented as independent validation.
Our own data, honestly.
- Participants stayed on the program for a median of about five months, logging on roughly 60% of days.
- Self-reported menstrual cramping fell 28% from the first to the last month on the program (p = 0.003).
- 22 of 105 sub-fertile participants (21%) reported a pregnancy during the program. The pilot had no control group, and pregnancies were self-reported.
Retrospective, single-arm and self-reported. These results justify, but do not replace, a controlled prospective study. This is our own historical data, not independent validation. Read the 2014–2016 pilot, including its limits.

26 years in reproductive health, including 20 in clinical practice. Former board-certified reproductive acupuncturist (ABORM). Author of Seeing Red (Simon & Schuster). Read about the science and clinical model behind Conceivable.
Conceivable works beside fertility care, not instead of it.
No questionnaire, wearable or cycle chart can identify every reason pregnancy has not happened.
Depending on your age and history, an appropriate evaluation may include semen analysis, ovulatory assessment, uterine and tubal evaluation, ovarian-reserve testing, endocrine or metabolic evaluation, and assessment for conditions such as PCOS or endometriosis. See the ASRM committee opinion on fertility evaluation of infertile women and the AUA/ASRM guideline on infertility in men.
Conceivable is designed to help you arrive at those conversations with a clearer picture of your own body.
There may be more information in your body than anyone has put together yet.
Sources
- Wesselink AK, Wise LA, Hatch EE, et al. Menstrual cycle characteristics and fecundability in a North American preconception cohort. Ann Epidemiol. 2016;26(7):482-487. PubMed 27449569
- Mountjoy M, et al. 2023 International Olympic Committee’s (IOC) consensus statement on Relative Energy Deficiency in Sport (REDs). Br J Sports Med. 2023. PubMed 37752011
- Practice Committee of the American Society for Reproductive Medicine. Fertility evaluation of infertile women: a committee opinion. Fertil Steril. 2021;116(5):1255-1265. PubMed 34607703
- Schlegel PN, et al. Diagnosis and treatment of infertility in men: AUA/ASRM guideline part I. Fertil Steril. 2021. PubMed 33309062
The Conceivable Score is a prioritization and tracking tool, not a diagnosis or a pregnancy probability. How the Conceivable Score works.